When Should I Buy a Home? Have We Reached Bottom Yet? What Is The Right Price?
Source:millionairemommynextdoor.com
My question has to do with the timing of buying (a home), especially in the current market. I would like to know from your perspective when a time to buy might be. I’m not asking for you to predict a date, but rather I’m interested to know what indicators and trends you might look at to make a decision to buy a home. Any response you have is much appreciated!” ~Adam
(Ed Note: The following is a reprint of an analysis I wrote in April, 2008. My family and I have since moved into a different rental home so the numbers I used to illustrate these concepts would be different today. However, the concepts remain the same. I’ve also added an update after the conclusion of this post.)
Using three indicators and the home my family currently rents as an example, I’ll illustrate how I gauge whether (or when) the time might be “right” to buy a home.
The home I rent today might sell for $250,000. We pay $1,295 per month for rent. It is a single-family home located in Colorado with four bedrooms, three baths, a two car attached garage, a fenced yard and 2,120 square feet.
First “Price is Right” Indicator: The Price-to-Rent Ratio
Rents are a useful barometer for tracking housing markets. Like a P/E (price-to-earning) ratio for a stock, a P/R (price-to-rent) ratio can help identify relative real estate bargains. The lower the ratio the better. The current price-to-rent (P/R) ratio for my home is 16.09 ($250,000 price divided by $15,540 annual rent).
The New York Times article, Ratios of Home Prices to Rental Prices in Selected Metro Areas indicates that the P/R ratio in Denver during the first quarter of 2000 (before the US asset-based economy switched from stocks to housing) was 11.6.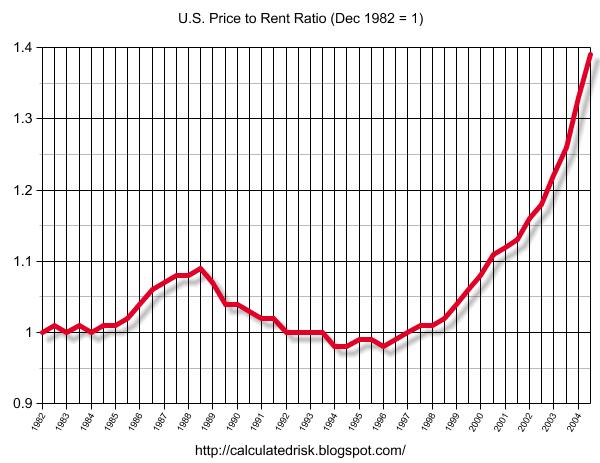
Therefore, the current P/R ratio on my home is 38.7% higher today than it was in 2000 (16.09 versus 11.6). If the P/R ratio for my home was to return to year 2000 “pre-bubble” levels, my home would sell for $153,250 today rather than $250,000. Therefore, unless I find a “bargain” – a foreclosure, short-sale or bank-owned property with a reasonable P/R ratio, I’ll probably wait until my local market returns to pre-bubble price-to-rent levels.
Second “Price is Right” Indicator: When will buying real estate make sense for landlords?
I recall times when local investors could buy a house with 20% down, rent it out at market rates, and make a positive cash flow in year one. In fact, I’ve done it before. But during the real estate bubble, investors speculated. They bought homes that created a negative cash flow, then counted on home appreciation to pay them back someday in the future. As with any investment, the more speculative, the more risky. I’d rather wait until I can buy rental investment homes that create positive cash flow from the get go. Future price appreciation would be icing on the cake.
My (speculative?) landlord bought our home in 2006, near the peak of the housing bubble. Here’s an estimate of the annual costs our landlord incurs on our home:Item Annual Cost Notes Down Payment $2,000 20% of $250k = $50k down. $50k x4% in T-bill, CD or bond instead. Mortgage Payment (P+I) $14,772 $200k @ 6.25% 30 yr fixed Property Taxes $1,500 0.6% of hm value Insurance $900 Maintenance, Repairs $2,331 15% gross annual rent (this is the minimum allowance typically recommended) Property Management Fees $1,399 9% of gross annual rent (8-10% is typical) Vacancies $1,295 1 month per year allowance Marketing and Leasing Fee (by Mngmt Co.) $583 90% of 1 mo. rent every 2 yrs (80-100% is typical fee) Auto Expense $0 (assuming owner relies 100% on mngmt company) Total Annual Cost $24,780
Item Annual Cost Notes
Down Payment $2,000 20% of $250k = $50k down. $50k x4% in T-bill, CD or bond instead.
Mortgage Payment (P+I) $14,772 $200k @ 6.25% 30 yr fixed
Property Taxes $1,500 0.6% of hm value
Insurance $900
Maintenance, Repairs $2,331 15% gross annual rent (this is the minimum allowance typically recommended)
Property Management Fees $1,399 9% of gross annual rent (8-10% is typical)
Vacancies $1,295 1 month per year allowance
Marketing and Leasing Fee (by Mngmt Co.) $583 90% of 1 mo. rent every 2 yrs (80-100% is typical fee)
Auto Expense $0 (assuming owner relies 100% on mngmt company)
Total Annual Cost $24,780
+ $15,540 Annual Gross Rent Collected
- $24,780 Annual Costs
= $9,240 Annual LOSS
Obviously our landlord was betting on home price appreciation to continue at unprecedented rates. Bummer.
In order to break-even in year one, our landlord needs to increase our rent from $1,295 to $2,065 per month. Of course if he tried to do this, we’d move out, no one would move in, and his investment property would sit vacant. Not good! So he’s not likely to raise the rent.
Alternatively, if he had bought at the “right” price with the intent to create a near break-even cash flow in year one, he’d have paid only $130,000.
$130,000 is 48% less than the current value of $250,000! Ouch!
If our landlord had bought this home for $130,000, this is what the math might look like:
| Item | Annual Cost | Notes |
| Down Payment | $1,040 | 20% of $130,000 = $26k down x4% in T-bill, CD or bond instead. |
| Mortgage Payment (P+I) | $7,680 | $104k @ 6.25% 30 yr fixed |
| Property Taxes | $780 | 0.6% of hm value |
| Insurance | $900 | |
| Maintenance, Repairs | $2,331 | 15% gross annual rent (minimum) |
| Property Management Fees | $1,399 | 9% of gross annual rent (8-10% is typical) |
| Vacancies | $1,295 | 1 month per year allowance |
| Marketing and Leasing Fee (by Mngmt Co.) | $583 | 90% of 1 mo. rent every 2 yrs (80-100% is typical) |
| Auto Expense | $0 | (assuming owner relies 100% on mngmt company) |
| Total Annual Cost | $16,008 |
Item Annual Cost Notes
Down Payment $1,040 20% of $130,000 = $26k down x4% in T-bill, CD or bond instead.
Mortgage Payment (P+I) $7,680 $104k @ 6.25% 30 yr fixed
Property Taxes $780 0.6% of hm value
Insurance $900
Maintenance, Repairs $2,331 15% gross annual rent (minimum)
Property Management Fees $1,399 9% of gross annual rent (8-10% is typical)
Vacancies $1,295 1 month per year allowance
Marketing and Leasing Fee (by Mngmt Co.) $583 90% of 1 mo. rent every 2 yrs (80-100% is typical)
Auto Expense $0 (assuming owner relies 100% on mngmt company)
Total Annual Cost $16,008
+ $15,540 Annual Gross Rent Collected
- $16,008 Annual Costs
= $468 Annual LOSS (almost break-even)
Third “Price is Right” Indicator: An “old” rule of thumb for establishing fair value of rental property is to multiply the annual gross rent by 6 (in not-so-great neighborhoods) to 10 (in premium neighborhoods). This gives you a “business” estimate of the value of a rental. In my case:
$15,540 annual rent x 6 = $93,240 value of rental (in not-so-great neighborhood)
to
$15,540 annual rent x 10 = $155,400 value of rental (in premium neighborhood)
Conclusion:
In my area, house prices are still elevated relative to rents.
Using the above indicators, the price of the home I’m renting should be between $130,000 and $155,400 — rather than the current $250,000. Significant price declines are needed to bring home prices back to their historical relationship to rents (and/or rents need to increase substantially) before the P/R ratio makes sense again.
June 2009 Update:
A year ago, we moved to a 3 bedroom, 2 bath condo. We pay $1150 per month in rent and this includes our water, sewer, trash, cable TV, yard maintenance, clubhouse, swimming pool, hot tub and exercise facility. These HOA benefits cost our landlord about $200 per month. Our landlord bought our condo for $177,100 in 2002. Therefore, our P/R (price to rent) ratio is just under 13 if you include the HOA benefits in our rent; or about 15.5 without them. The most recent comparable sales price I can find for a similar unit was $160,000 in March 2007. I don’t know what our condo would sell for today, but the price would need to drop to $132,240 for the P/R ratio to match our local 11.6 pre-bubble average.
We will continue to rent for as long as it is cheaper to do so. We enjoy our modern condo with all of it’s amenities and proximity to a huge park. This said, we ARE looking to buy land or a home eventually — but only if we can find one for the right price! We are in an enviable position — we can make a low price offer sound appealing to the right seller — because we don’t require a mortgage, we can pay cash if necessary, and we don’t have any home sale contingency to delay closing. When the time and price is right, we will find (or build) our little green dream home.
Readers: What indicator(s) are you watching to access real estate values? When do you think the market will hit bottom? Please do your own math for your own local market and leave your results in the comments for comparison and discussion.

![[Most Recent Quotes from www.kitco.com]](http://www.kitconet.com/charts/metals/gold/t24_au_en_usoz_2.gif)
![[Most Recent Quotes from www.kitco.com]](http://www.kitconet.com/charts/metals/silver/t24_ag_en_usoz_2.gif)
0 comments:
Post a Comment